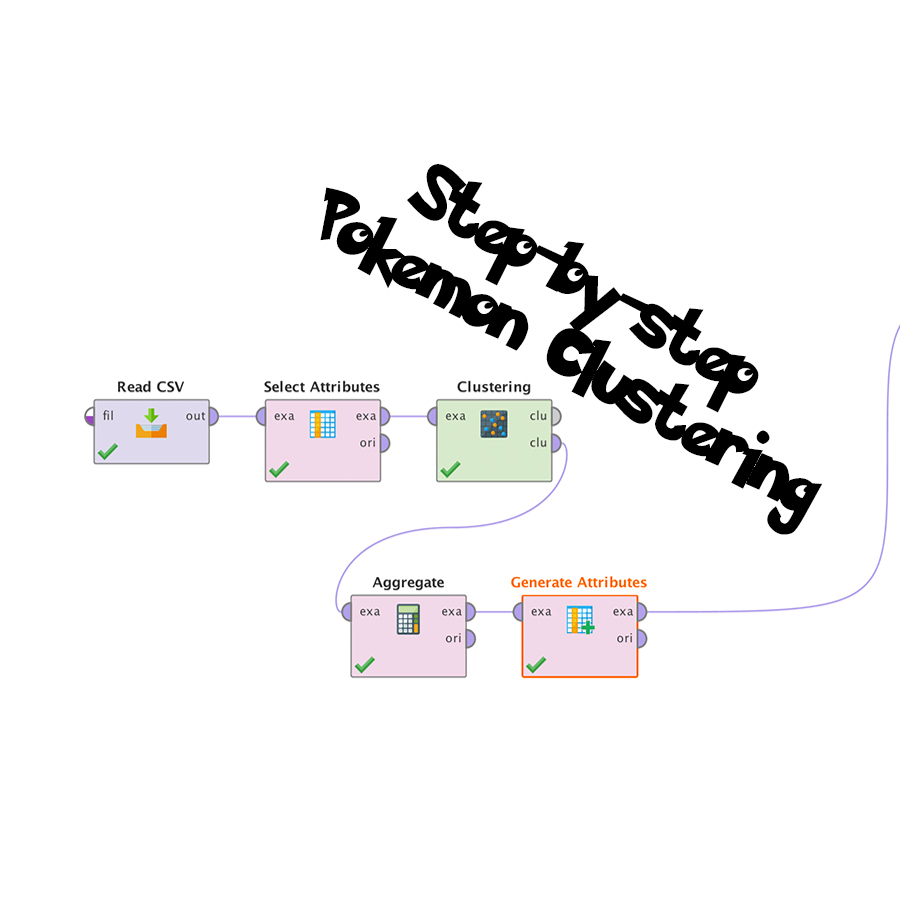
Step-by-step Pokemon Go Clustering

Last Sunday I’ve the honour of introducing basic concepts of data mining to a group of enthusiast who signed up for the talk on my blog. During the talk, they were introduced to how I collect the data, how the data were processed and how the data were data mined. They also have a first-hand experience of analysing the nest through the clustering technique. In this post, I’ll be walking through the steps to find and rank the Pokemon nests. The data used for the analysis can be downloaded in this post, so make sure you follow along!
Before We Start
- Download RapidMiner (RapidMiner Studio 7.2)
- Install & activate a free license (Launch the application, you will be prompted to sign up for an account for the free license)
- Download the Pokemon dataset
Introduction
For this task, we will use past data of Pokemon Spawns to attempt to predict future spawns. On top of that, we will also attempt to rank these spawn locations to determine the best place to search for specific Pokemon. So if we are searching for Dratini nest in Singapore, we will analyse the past spawn data for Dratini and from there, draw out the different nests and rank them.
Dataset Information
This dataset contains one of the latest data before the scanners went down after Niantics implemented the captcha. It contains a file “Distributed.csv” that contained the last 1 million data points. In addition, up to 1 million data points of individual Pokemon were also made available for the following Pokemon:
- Charmander
- Pikachu
- Abra
- Gastly
- Onix
- Likitung
- Chansey
- Scyther
- Lapras
- Porygon
- Aerodactyl
- Snorlax
- Dratini
- Dragonite
Step 1 – Load the data into Rapidminer
Before any analysis, we need to load the data into the program. Fire up your Rapidminer application, and if you have not registered a free license, it’s a good time to do so now.
Watch the video (on your left!) to learn how to import data from CSV, change the date type from nominal to date and visualise the data.
Step 2 – Filter the data by specific ID
From the previous video, we can see that there are too many data and it become very noisy. We will now learn to filter the data by the Pokemon ID. In this video, we will only show Dratini spawn data.
Watch the video to learn how to filter data.
Step 3 – Simple K-mean Clustering
In this video, we will load another dataset containing only Dratini spawn data. From there, we will dive into our first data mining task – clustering. Clustering algorithms helps to group similar data points together. In this case, it is perfect for grouping points with similar latitude and longitude.
I would like to explain K-mean as a child drawing circles. All you need to do is to tell the child how many circles to draw around the points. The child will then draw circles around the points to group them into the number of groups you like.
In this case, we will attempt to use k = 3 and k = 200.
Watch the video to see how we can use K-mean algorithm to “draw circles” around the data points!
Step 4 – Aggregating by Cluster
Now that we have grouped the data into various clusters, there are still too many data points and it is not possible to make any sense of where are the nests at this point in time.
In this part, we will aggregate the points in each cluster. This means that all points belonging to cluster 1 will now become one point. All point that belong to cluster 2 will become one point. So technically if we have 200 clusters, we will have only 200 points left (compared to 10,000 points). We will preserve information of the aggregated data by calculating the average/mean, standard deviation and count.
At the end, a Pokemon nest will then be a spot where the count (number of Pokemon spawned) is high and the standard deviation (distance between Pokemon spawned) is low.
We plot an Advanced Chart in this case to show us the results visually. With count as the colour and standard deviation of latitude as the size, we will want a point that is red and small.
Step 5 – Ranking the Nest by Score
Instead of looking at the attributes separately, we can also generate another attribute, Score, that combines all the value. Like what I’ve mentioned earlier, we want a point with high count and low standard deviation. In this case, we will use a REALLY SIMPLE function that does it. We will simply divide the count by the sum of the standard deviations (plus one to prevent division by zero).
Now, with this data, head over to Google map to find the nest!
Ending Notes
This video walkthrough is a watered down version of the analysis that allow beginners to get started. I’ll be discussing another algorithm, DBSCAN, to location Pokemon nest in another blog post. If you have any questions, feel free to contact me.